Improve Your 3D Printed Parts with Open-Source 3D Printer Research
Want better 3D printed parts? Find out how you can improve the quality of your 3D prints using scientific research provided by Valparaiso University.
Experimental Determination of the Effects of Slicer Settings on the Mechanical Strength of Fused Filament Fabrication Manufactured Specimens
Samuel Hart and Trevor Gray
Mechanical Engineering
Valparaiso University
Valparaiso, Indiana
Dr. Daniel Blood
Assistant Professor of Mechanical Engineering and Bioengineering
Valparaiso University
Valparaiso, Indiana
ABSTRACT:
The consumer-level Fused Filament Fabrication (FFF) community has little scientific information available on the mechanical properties of printed parts. Even less is known about the relationship between slicer settings, such as hotend temperature, and the resulting mechanical strength with various filaments. This paper presents a proposed method of characterizing the relationship between slicer settings for different filament types and the resulting mechanical strength of FFF parts. Additionally, results of testing MatterHackers’ MH Build PLA, PRO Series PLA, PRO Series ABS, PRO Series PETG, PRO Series Nylon, and NylonX filaments are reported. It is found that NylonX has the highest strength to weight ratio at 92 lbf/g, MH Build PLA has the highest peak load at 478 lbf, and PRO Series Nylon has the highest ductility of the filaments tested with 25.6% strain at failure. PRO Series PLA strength relies the least on the direction of the applied force with an isotropic rating of 50%. Additional parameters, such as part fan speed, print speed, and infill percentage, are tested to determine their effect on tensile strength.
1. INTRODUCTION
1.1 Motivation
The expiration of Stratasys’ Fused Deposition Modeling (FDM) patent in 2009 resulted in a previously unimaginable explosion in do-it-yourself (DIY) tech [1]. The open-source community renamed the printing process Fused Filament Fabrication (FFF) to prevent infringement on Stratasys’ FDM trademark. Filament based 3D printing maintains its position as the primary printer technology for consumers due to the relative low cost of entry, and the global support community. The competitive FFF printer market changes at a staggering pace from year to year, and new capabilities are allowed by this new tech. Innovations in printer hardware and new types of filament provide users with an ever-expanding array of options. While many of these innovations are designed to make printers more user-friendly, many more claim to produce the ‘best’ prints possible; however, without a scientific comparison of the alternatives it's impossible to validate these claims. The research team at Valparaiso University (Valpo) recognizes that there is a need for unbiased evaluation of printer components and consumables, and the team has spent two years developing a repeatable method of evaluation.
[1] Crump, S. Scott, “Apparatus and Method for Creating Three-Dimensional Objects,” U.S. Patent 5 121 329, 9 June 9, 1992.
1.2 Identifying Factors that Affect Printed Parts
A goal for most 3D printing enthusiasts is to produce parts that are aesthetically pleasing, and have relatively high mechanical strength. Unfortunately, these two desired traits may not be possible with the same printer/filament/slicer setting combinations, and only the individual printing the part can determine if they want function, form, or a mix. An additional challenge with quantifying aesthetics is the subjective nature of attractiveness. Figure 1 shows an example of two prints that come from the same model and overall settings, but with a difference in the .STL resolution resulting in ‘smooth’ and ‘low-poly’ prints. Due to the subjective nature of aesthetics, the Valparaiso University research team is focusing on quantifying mechanical properties.
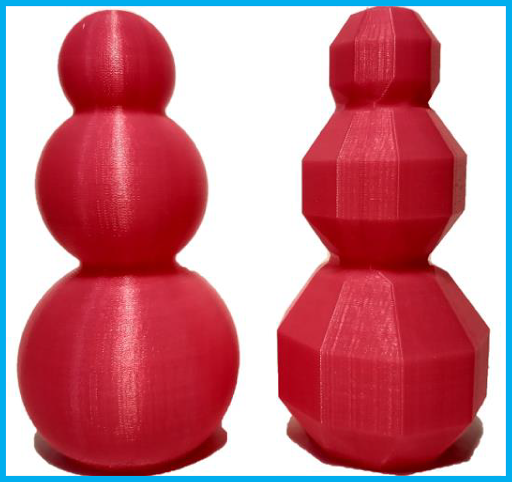
Figure 1. Examples of snowman prints in high resolution (left) and low-poly (right).
The first step in evaluating strength is identifying failure modes of printed parts. Preliminary tensile testing of FFF specimens reveals three primary modes of failure: yielding of the material, delamination between Z-layers, and delamination in the X-Y direction. Next, process parameters are identified that may contribute to failure for each of the three modes. The following conclusions are based on analysis of the failed specimens, review of slicer settings, and comparison of printer components.
1.2.1 Failure Due to Yielding
Yield strength is defined as the transition from elastic (recoverable) deformation to plastic (permanent) deformation [2]. In the case of an injection molded part, this is largely due to the material properties of the polymer, and the internal residual stresses as a result of the injection process. FFF printing is similar to injection molding in this respect, but changes in material properties and the physical process of generating internal residual stresses are unique. Extruded material properties are mostly a function of the polymer type, but the material properties are also affected by the level of polymer degradation. This degradation of the polymers can occur from moisture, ultra-violet (UV) light, chemicals, and most notable for FFF printing, heating. Some degradation likely occurs before the user receives the filament due to the potential use of recycled plastics, and heating of the polymer at the time of filament production. Further degradation can occur on the user’s end from improper filament storage, or overheating during extrusion. Consequently, the three items identified as important for material properties are filament type (material, manufacturer, and storage history), extruder-hotend-nozzle combination, and slicer settings (hotend temperature and extrusion rate).
Internal residual stresses are caused by the uneven cooling of a material. Injection molded parts typically cool quicker on the outside surfaces as compared to the inside. The polymer becomes more rigid and contracts as it cools; consequently, if the outside surface cools too rapidly the internal material will have no way to freely contract. Figure 2 shows an example of this phenomenon with a visible dip in the injection molded part surface. This results in a non-zero state of stress in the part before any external loads are applied, and ultimately will affect the yield strength. FFF printed parts experience a similar inconsistency in cooling, but it is caused by the delay between extrusion of the layers. New layers are extruded at a higher temperature than the cooled previous layer, and when the new layer cools it will cause a contraction of both layers. Figure 3 demonstrates warping of printed parts that commonly occurs without a heated bed or controlled environmental conditions. Printing on a heated bed or controlling ambient temperatures allows each layer to cool to a higher ambient temperature, and thus results in a more consistent cooling of layers and reduced warping. The primary items identified as important for internal residual stresses are filament type (material), printer ambient conditions (heated bed and heated chamber), and slicer settings (hotend temperature and extrusion speed).
[2] Beer, Ferdinand P., et al., Mechanics of Materials, McGraw-Hill Education (India) Private Limited, 2017.
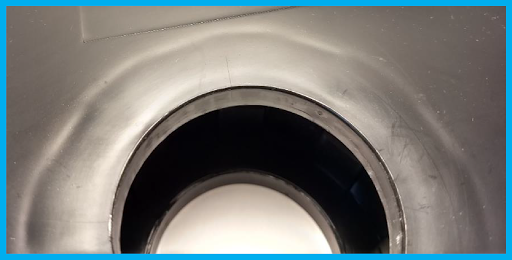
Figure 2. Dip in the surface of a roll of filament due to contraction during uneven cooling.
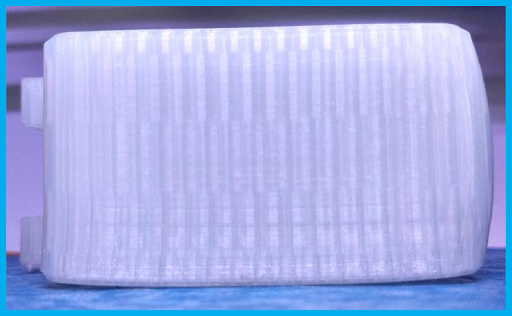
Figure 3. Warping of printed part on the build surface.
1.2.2 Failure Due to Delamination in the Z-Direction
Delamination of Z-layers, as seen in Figure 4, occurs when there is insufficient bonding between printed layers. This may be a result of incorrect extrusion temperature resulting in a cold joint, excessive contraction between layers, or from foreign contaminants preventing proper physiochemical adhesion. The identified causes of delamination are primarily due to the filament (material, manufacturer, and storage history), extruder-hotend-nozzle combination, printer heating capability (bed and chamber), and slicer settings (hotend temperature).
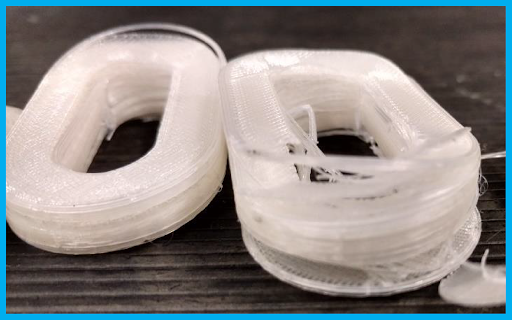
Figure 4. Delamination of PLA specimens in the z-direction.
1.2.3 Failure Due to Delamination in the X-Y Direction
Geometric accuracy of injection molded parts is heavily influenced by the quality of the mold and the cooling of the parts after injection, but FFF print accuracy is dependent on the ability to precisely control the position and amount of filament extruded. The correct amount of the material must be extruded in the correct location for each layer. The material is extruded in lines that may be parallel or overlap other extruded lines. The quality of the line-to-line bond is important to prevent extruded lines from separating under load. Slicing software typically modifies the extruder path to create overlap between outlines and infill to promote adhesion, but if the extrusion settings are incorrect there may be insufficient material extruded to allow proper bonding between the respective extruded lines. The identified variables affecting delamination in the X-Y direction are filament (material, manufacturer, and storage history), extruder-hotend-nozzle combination, printer motion system accuracy/repeatability, and slicer settings (hotend temperature, outline overlap, and extrusion multiplier).
1.3 Testing Parameters for Phase One
Table 1: Failure modes and identified causes of failure.
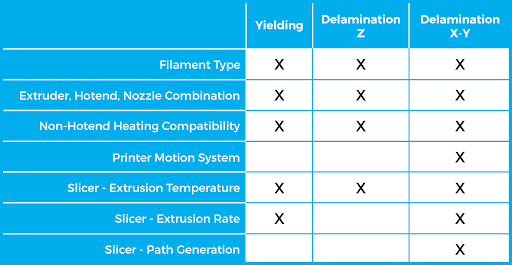
Table 1 shows a summary of the previous section analysis. The seemingly limitless combination of the above factors makes it impractical to test every possible variable at once. The Valpo team recognizes that many consumers are financially restricted on hardware modifications, and the consumer community will benefit more from a guide on free software-based changes to their printing process. The team also identified the importance of performing early tests with commonly utilized components so that results are more likely to apply to a typical user’s setup.
1.4 Testing ‘Dumbbell’ Specimens
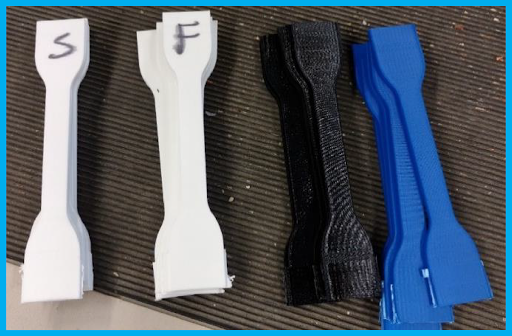
Figure 5. FFF printed 'dumbbell' specimens.
The first specimen geometry tested is the ASTM D412-06a ‘dumbbell’, as seen in Figure 5. This testing standard evaluates tensile properties of both thermoplastic elastomers and vulcanized thermoset rubbers. This standard was initially selected to allow testing of rigid filaments like PLA, and flexible filaments like TPU/TPE.
Preliminary tests with the ‘dumbbell’ specimen reveal that the geometry may be effective for testing polymer/elastomer sheets, but it is not conducive for FFF printed part testing. The geometry’s faults are as follows:
- The specimen must be clamped on both ends for tensile tests, and this restricts the user to 100% infill of the ends to prevent crushing.
- Any misalignment of the specimen in the testing apparatus results in non-uniaxial forces that contribute to inconsistent peak specimen loads.
- Printing the specimens in a vertical orientation results in a relatively tall and slender print that is prone to geometric printing errors at the top.
- The vertical arrangement also results in stacked potential failure points, and the weakest layer bond controls the breaking strength.
- The dimensions of the specimen limits variation in the percent infill, number of outlines, and number of top/bottom layers.
- The distance between the top surface of the printed part and the printer bed is several orders of magnitude different for vertical and horizontally printed specimens. The difference in part heating can affect the bond strength, and this would result in non-equivalent comparison of the two print orientations.
- Few horizontally oriented specimens can be printed at one time so it reduces batch specimen print size.
These shortcomings demonstrate the need for a new specimen geometry to properly characterize the FFF process.
2. EXPERIMENTAL SETUP
2.1 Tensile Specimen Geometry
The inherent variability of FFF 3D printers made it challenging to select the specimen geometry that results in the most consistent tensile testing. The goal is to find the most appropriate specimen geometry where the results can be extrapolated to multiple hotend and printer combinations. Desired properties of the new specimen are:
- The ability to print the specimen in different orientations without common printer limitations affecting the specimen strength.
- A geometry that allows for a multitude of slicer settings to change the resulting printed specimen.
- Relatively low specimen volume to minimize print time and cost.
- Relatively small footprint to enable large batch sizes.
- Ease of removal from printer bed to minimize the effect of specimen handling.
- Ability to minimize non-uniaxial forces produced from misalignment in the tensile testing apparatus.
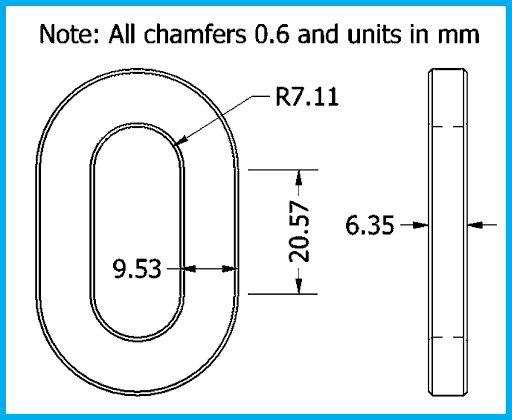
Figure 6. Technical drawing of new specimen.
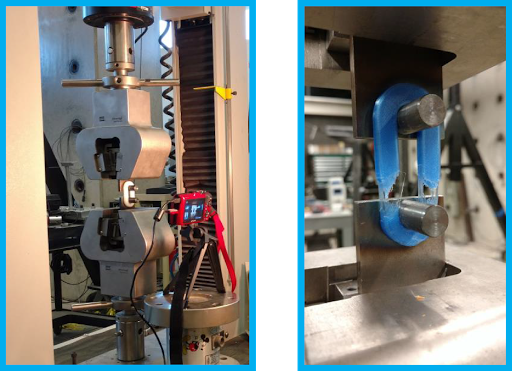
Figure 7. New specimen design loaded in MTS QTest 150 tensile testing machine. View of the custom loading pins in the MTS machine (left) and post-testing PETG specimen (right).
The new specimen design, as shown in Figure 6 and 7, overcomes the challenges discovered in the first set of tests in several ways. First, the new specimen geometry self-aligns when performing tensile testing due to the use of loading pins instead of clamps. This also eliminates the need for clamping onto solid sections of the specimen. The new loading process introduces a higher level of repeatability and reduces the cycle time for tests. The specimen shape is also designed with slicer settings in mind; specifically, top/bottom layers, number of outlines, and percent infill. The thicker specimen allows for a wider range of these settings to be tested on the same geometry. The print area decreases from 2500 mm2 to 1100 mm2, and the solid body volume remains relatively low at 7000 mm3. Lastly, the shape allows for the parts to be printed in a number of configurations without requiring significant supports, or increasing the length to thickness ratio excessively.
2.2 Printing Hardware and Filament
The Prusa i3 MK2 printer is used as the testing hardware due to the sub $1000 price tag, a direct-drive extruder, a heated bed, genuine E3D-V6 hotend, and auto-leveling hardware. Also, there is no enclosure to protect the specimen or printer from the home environment. This allows for more generalization as most budget consumer printers do not have enclosures. In the future, an enclosure will be added so the benefits of environmental protection from disturbances, such as drafts from an AC vent, can be quantified. The printers were assembled by one individual on the team. The only modification made to the printers is exchanging the brass nozzle for a hardened steel nozzle of the same diameter when printing NylonX. This is done to prevent wear so that the brass nozzles can be used for future specimens.
MatterHackers’ filament is used for the testing due to its widespread use, availability of filament types, and their filament specific suggestions for baseline slicer settings. In the name of transparency it should also be noted that MatterHackers donated filament to support this research, but all results are fully generated by the Valparaiso University team without modification.
2.3 Batch Printing Configuration
Ten specimens are printed in each batch to limit print time while maintaining smaller printer compatibility. Additional batches are printed after the ‘best’ extrusion temperature is determined to reduce uncertainty. A total of thirty specimens are produced for the ‘best’, ‘best’+5 ˚C, and ‘best’-5 ˚C extrusion temperatures respectively. Layout of the specimens, as seen in Figure 8, is dictated automatically by Simplify3D. This eliminates the chance of inconsistent spacing when creating new print files. Specimens and unused filament are stored inside a Ziploc WeatherShield 26.5 Quart Storage container with a 1.7 lbm silica gel desiccant bead canister until testing or printing. Tensile testing is typically completed within 3 days of printing the specimens.
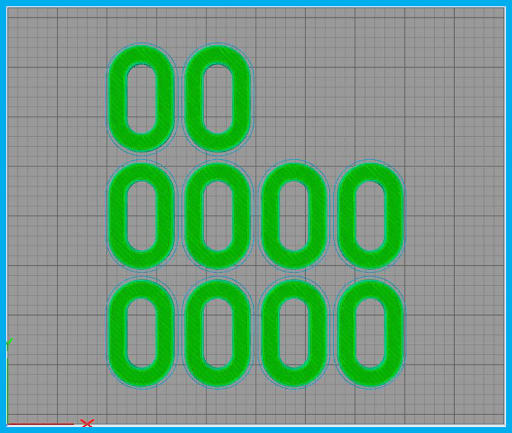
Figure 8: Simplify3D layout of ten tensile specimens on a Prusa i3 MK2.
2.4 Slicer Software
Simplify3D is used as the slicer software due to its versatility with setting choices and its popularity among consumers. All baseline parameters are pulled from the MatterHackers online guide. If a range is given then the mean value is used. Testing focuses heavily on determining the ‘best’ hotend temperatures for each respective filament. This is defined as the minimum temperature where the tensile strength remains relatively constant regardless of an increase in the extrusion temperature. The lowest value is reported to minimize oozing/zits common with higher extrusion temperatures. The most appropriate hotend temperature is a hotly debated topic within the printing community; however, countless variables can affect the ‘best’ temperature for each filament type. The hotend temperature is the only parameter varied in the first set of tests. Additional tests are performed after the ‘best’ hotend temperature is determined. These tests simultaneously vary different parameters to determine tensile strength sensitivity.
All the prints are performed using an SD card for g-code transfer. Inconsistent transfer of the g-code to the printer from a computer can arise due to connection or software issues, and the use of a SD card eliminates that additional variability.
3. TESTING METHODOLOGY
3.1 Verification of Equivalent Printer Assumption
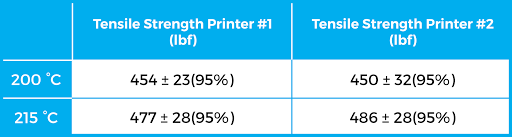
Two Prusa i3 MK2s are used in this phase to expedite testing. It is necessary to validate the null hypothesis that any difference in the tensile strength between the two printers is due to the inherent variability in the process. These tests used a single roll of black MH Build Series PLA printed at 200 °C and 215 °C respectively. Results for these test are shown in Table 2. A two-way analysis of variance is conducted on the tensile strength of the specimens after tensile testing. The effect of using two separate printers is not statistically significant at the 0.05 significance level (F ratio = 0.024, p>0.05). The statistically insignificant difference justifies the move to treat variability introduced by the two printers as negligible
Table 2: Tensile test results to determine if it is appropriate to consider the printers as equivalent.
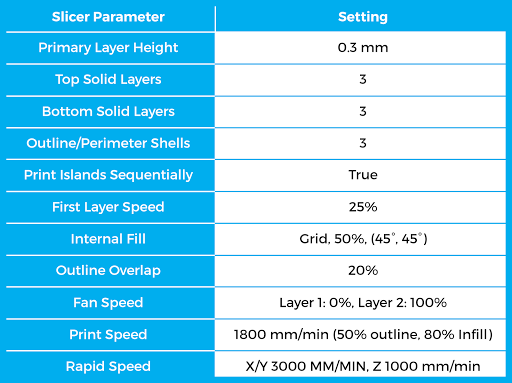
A selection of the baseline slicer settings for the printed specimens are listed in Table 3, and detailed screenshots of settings are provided in the appendix. Non-filament specific settings, such as print speed, are generated from the Prusa i3 MK2 profile on Prusa’s official website. Any remaining settings are selected from past experience and knowledge from the Valpo team.
Table 3: A selection of the slicer baseline slicer settings used in the first set of tests.
3.3 Determination of Minimum Hotend Temperature
Minimum hotend temperature for each type of filament is determined from analysis of both the peak load and strength to weight ratios. Most temperature tests start at 15 °C below the MatterHackers average recommended hotend temperature; however, in some cases after data is reviewed, it may be determined that the minimum hotend temperature is not reached. In these cases, hotend temperature is dropped by 5 °C for every batch until either the minimum temperature is found, or print failure occurs (e.g. delamination in the z-direction during printing).
3.4 Tensile Testing Procedure
After a batch of specimens finishes printing, it is placed in a Ziploc WeatherShield 26.5 Quart Storage container with a 1.7 lbm silica gel desiccant bead canister inside for at least 8 hours. Specimens are tested at room temperature, 70 ± 5 °F. When enough specimens are printed, each batch is then weighed with an AWS-100 scale, and the average recorded. Specimens are loaded into a MTS QTest 150 tensile machine via the loading pins which start with a center-to-center distance of approximately 19 mm. A constant elongation rate of 5 mm/min is applied when testing begins. This testing speed is based off the ASTM standard discussed previously. A 33700 lbf (150 kN) MTS load cell is used to measure the applied load, the displacement is based on the frame readings, and the data is collected by a Dell Optiplex 990 PC at 60 Hz.
4. RESULTS
4.1 Hotend Tensile Results
Table 4: Tensile test results for MatterHackers filament. Values represent the average for specimens printed at or above the minimum recommended hotend temperature.
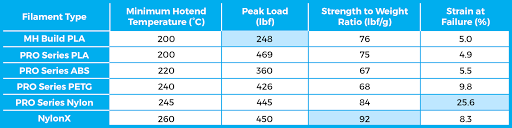
A comparison of the experimentally determined tensile properties for each respective filament type is presented in Table 4. The table compares prints of MatterHackers MH Build PLA, PRO Series PLA, PRO Series PETG, PRO Series ABS, PRO Series Nylon, and NylonX. The peak load, strength to weight ratio, and strain at failure are all averages of specimens that meet or exceed the minimum suggested hotend temperature. The units of lbf/g are selected for the strength to weight ratio due to users’ familiarity with lbf and the common practice of measuring filament/prints in grams.
These numbers are not meant to predict the strength of a user’s specific printed part. The results are simply used to determine the relative strength of one filament to another. This allows a wider audience to apply the lessons learned towards their own prints. The complex nature of FFF printed parts requires a more complex analysis of stress concentrators, loading direction/type/rate, and the effects of operating temperature/humidity/age/etc… to determine the mechanical properties of a specific part.
4.1.1 Black MH Build PLA
MatterHackers Black MH Build PLA is the first filament tested. Figure 9 shows the hotend-temperature strength to weight ratio (S-W) curve for Black MH Build PLA. The plot shows that an increase from 185 °C to 200 °C yields a 43% increase in the strength to weight ratio. The graph shows that after 200 °C the peak load remains relatively constant; consequently, the recommended minimum hotend temperature for Black MH Build PLA is 200 °C.
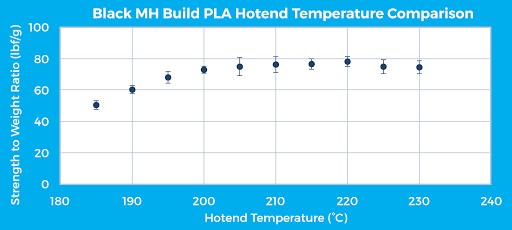
Figure 9: MatterHackers Black MH Build PLA hotend temperature comparison for a horizontal specimen print orientation.
4.1.2 Black PRO Series PLA
Figure 10 shows the results for MatterHackers Black PRO Series PLA. It is expected that PRO Series PLA will perform similar to the MH Build PLA, and above the 200 °C mark the two materials produce similar results; however, PRO Series PLA did not experience the drop off in strength below 200 °C. The authors recommend printing with at least 200 °C for this particular printer setup due to the slight increase in the S-W ratio; however, it does not appear that there will be a significant reduction in the part strength for this testing orientation below 200 °C.
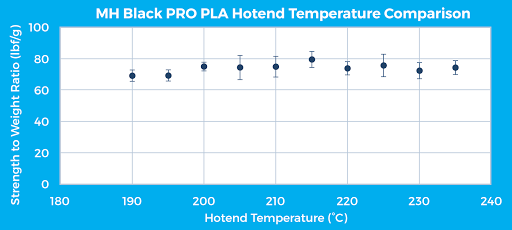
Figure 10: MatterHackers Black PRO Series PLA hotend temperature comparison for a horizontal specimen print orientation.
4.1.3 Black PRO Series ABS
Black PRO Series ABS filament produced the weakest prints with most failing below 400 lbf. Figure 11 shows the inconsistent S-W ratio trend for the tested hotend temperatures. One issue with printing the ABS specimens is that warping of the specimens occurs for most batches. It is possible that the specimens perform poorly during tensile testing due to residual stresses induced by the uneven cooling, and an increase in the ambient temperature might reduce this effect. Additional tests beyond the initial ten specimens are not performed due to the challenges in printing ABS with the current setup. The Valpo team is hesitant to make a suggestion without additional tests in an elevated temperature printing environment, but the specimens printed at 220 °C demonstrated the highest peak load and greatest ductility; therefore, that is the current suggested minimum hotend temperature.
Future tests on all filament types will reveal what improvements in the tensile strength are to be had with an elevated ambient temperature.
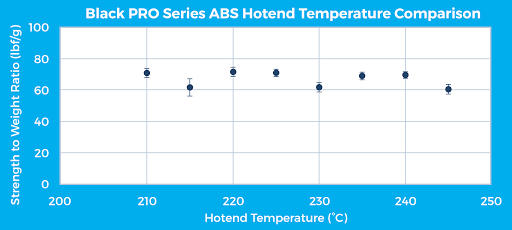
Figure 11: MatterHackers Black PRO Series ABS hotend temperature comparison for a horizontal specimen print orientation.
4.1.4 Red PRO Series PETG
Red PRO Series PETG results, as shown in Figure 12, reveal an increase in the S-W ratio from 235 °C to 240 °C, and then a relatively constant S-W ratio above 240 °C. This leads the Valpo team to suggest a minimum hotend temperature of 240 °C. It is important to note that although PRO Series PETG has a lower S-W ratio as compared to PLA, it did not fail in a brittle manner. PRO Series PETG specimens typically stayed intact, and had approximately double the elongation before failure as compared to PLA. This increase in the elongation lead to an approximately threefold increase in the toughness due to the shape of the stress-strain curve. The higher extrusion temperature and slight variability of samples leads the Valpo team to hypothesize that additional gains in strength may be found with an increase in the ambient print temperature.

Figure 12: MatterHackers Red PRO Series PETG hotend temperature comparison for a horizontal specimen print orientation.
4.1.5 Blue PRO Series Nylon
Nylon is widely considered as a relatively ductile polymer. MatterHackers Blue PRO Series Nylon performed as expected with the highest ductility rating of all filaments by more than 100%. PRO Series Nylon’s most interesting characteristic is its failure modes. At lower hotend temperatures PRO Series Nylon’s layers delaminate causing peak load capability to drop. The delamination effect disappears after a hotend temperature threshold of 245 °C is obtained, and the failure mode transitions into a more expected yielding failure. Both PRO Series PETG and NylonX experience the delamination failure, but the Nylon filament requires a higher hotend temperature before the failure mode dies out. Figure 13 shows that the S-W ratio dips at 250 °C and the Valpo team believes this is due to a single 10 specimen batch that exhibited lower S-W ratios as compared to the other batches at 250 °C. The suggested minimum hotend temperature for PRO Series Nylon on this particular setup is 245 °C.
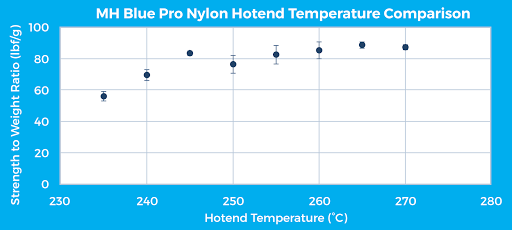
Figure 13: MatterHackers Blue PRO Series Nylon hotend temperature comparison for a horizontal specimen print orientation.
4.1.6 NylonX
Perhaps the most interesting filament test results are MatterHackers’ NylonX. There is significant difficulty bonding the z-layers of NylonX at low hotend temperatures. The team attributes this to an open print bed environment rather than an enclosed chamber. The S-W ratio of NylonX is the lowest of all filaments tested at the low temperature end, but it achieves the highest rating after the 260 °C mark. Utilizing a hardened steel nozzle of 0.4 mm allowed the team to preserve the brass nozzles for testing continuity, but the lower thermal conductivity of the steel limits heat transfer to the filament. To rectify this, the team printed at higher hotend temperatures than other filaments. Figure 14 shows that increasing the hotend temperature from 255 °C to 260 °C results in a 55% increase in the S-W ratio. The suggested hotend temperature for NylonX with a hardened steel nozzle is at least 260 °C.
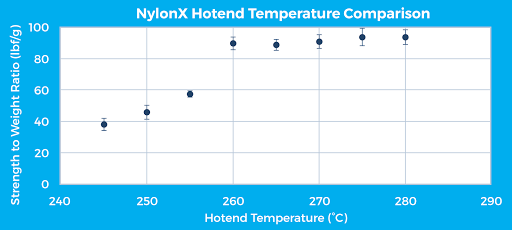
Figure 14: MatterHackers NylonX hotend temperature comparison for a horizontal specimen print orientation.
4.2 Additional Tests
Determining minimum hotend temperatures is an important aspect of FFF printing, but it does not encompass all of the factors that affect print strength. The Valparaiso University team realizes that the tensile strength of parts printed in the previous section are dependent on additional factors such as part fan cooling, z-layer height, number of outlines, number of top/bottom layers, infill percentage, and print speed. An in-depth analysis of all these factors would require a paper of its own, but these preliminary results should assist users in making more informed decisions about their slicer settings.
4.2.1 Part Fan Cooling
Table 5: Tensile results for part fan tests with Black MH Build PLA.

The use of a part fan can increase the capabilities of a printer during bridging operations or for areas with steep angles, but it also may affect the ability for layers to bond. Testing this effect on the tensile strength first requires determining the minimum hotend temperature, and then printing a batch of thirty specimens in Black MH Build PLA with the part fan off. Table 5 shows that printing with the part fan off produces a statistically significant effect on the peak load; however, the increase in strength is only 5%. The fan’s low impact on part strength signifies that the fan can be used with a statistically significant, but minimal effect on the strength of PLA parts.
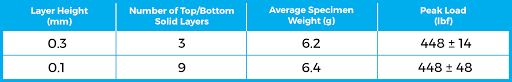
4.2.2 Layer Height
Reducing the layer thickness can have a positive effect on the cosmetic appearance of a printed part, but it can also increase the overall print time. These are relatively easy results to predict with modern slicer outputs, but the effect on mechanical strength with different layer thicknesses is unknown.
Specimens from section 4 are printed with 0.3 mm layer heights to decrease the overall print time. Additional tests are run with 0.1 mm layers to determine if the thinner layers have a statistically significant effect on the tensile strength. One additional modification to the baseline g-code is to adjust the number of top and bottom solid layers. This is an attempt to maintain the overall thickness of the solid layers on the top and bottom of each tensile specimen.
Table 6 shows the results of the layer height test, and the 0.3 mm and 0.1 mm tensile results are statistically similar. Additional tests are necessary to improve the statistical certainty that layer height does not affect the tensile strength of specimens, but these preliminary tests suggest that it does not play a significant role.
Table 6: Tensile results for layer height tests with Black MH Build PLA.
4.2.3 Outlines or Top/Bottom Layers
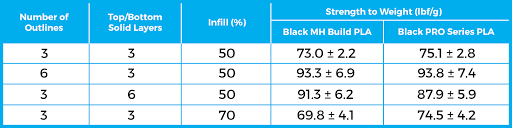
Adding material to printed parts can increase the overall strength. The user can add outlines, top/bottom solid layers, or increase infill percentage, but which method of addition is most effective in increasing strength? The Valpo team printed specimens with double the number of outlines, double the solid layers on the top/bottom, and an increase to 70% infill. The value of 70% infill is selected due to the similar specimen weight compared to the other two modified specimens.
Analysis of the results in Table 7 demonstrates that an increase in the strength to weight ratio is possible with outlines and solid layers, but that increasing the infill percentage did not have a statistically significant effect. It is important to note that the type of loading and print geometry is critical to where material should be added. Compressive loads or complex geometry may shift the important regions. Future tests with different loading configurations may shine light on these effects.
Table 7: Tensile strength of specimens with added material in different regions.
4.2.4 Infill
The previous section reviews the effect of an increase from 50% infill to 70% infill. Additional infill percentages need to be investigated to determine if the increase in strength follows a trend.
Figure 15 displays percent infill versus peak load for specimens undergoing tensile loading. This graph shows that from 50% to 80% infill the slope for increasing strength is relatively shallow; however, the slope is approximately four times greater above 80% infill. This is likely due to increased bonding between infill lines. These results will need to be repeated for other geometries and loads, such as pure compression, to definitively state a greater increase in the peak load is observed for the 80-100% infill range.
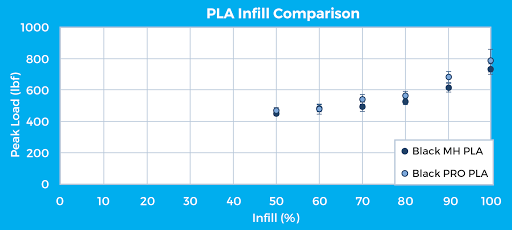
Figure 15: MatterHackers Black MH Build PLA and Black PRO Series PLA percent infill versus peak load.
4.2.5 Print Speed
Print speed is another factor that typically has an effect on the user experience. The ability to print ever faster is a demand on the FFF industry, but the effect of this increase in print speed on part strength is sometimes overlooked.
The Prusa i3 MK2 baseline specimens are all printed at 1800 mm/min with the intent of minimizing geometric errors. The printer is, however, capable of printing faster. Additional speed test results are shown in Figure 16. Black MH Build PLA shows no statistically significant decrease in strength when increasing the speed from 1800 to 3600 mm/min, but at 4800 mm/min the S-W ratio decreases by 8%. Black PRO Series PLA S-W ratio slightly increases at 3600 mm/min, but similar to MH Build PLA it decreases at 4800 mm/min. Only the end user can determine if this decrease in strength is acceptable, and if there are additional cosmetic effects from printing at these higher speeds. The effect of increasing print speed will likely change based on the geometric accuracy of printers at higher speeds, and on the ability of the hotend-nozzle combination to transfer sufficient energy into the extruded filament.
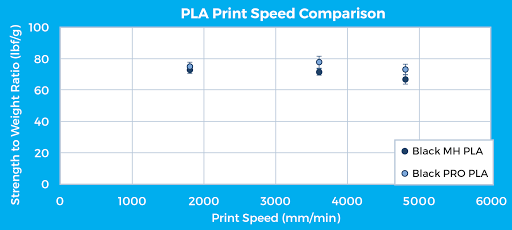
Figure 16: Black MH Build PLA and Black PRO Series PLA print speed versus strength.
4.3 Summary of Test Results
Table 8: Comparison of MatterHackers filaments.
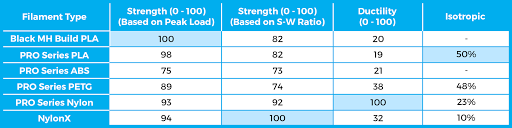
Table 8 shows the relative ratings of peak load, strength to weight ratio, ductility, and isotropic (non-directionality of strength). Analyzing the table shows that MH Build PLA and PRO Series PLA are excellent general use filaments for the average user. They have high peak loads, and exhibit the best isotropic rating. The main drawback is the relatively brittle failure as compared to PRO Series PETG and PRO Series Nylon.
PRO Series ABS performed poorly in the tensile tests with the lowest peak load, S-W ratio, and relatively low ductility. These results, coupled with the challenge of warping specimens, make it hard to recommend ABS for this printer setup. The emission of styrene while printing ABS further reduces the attractiveness of this filament type [3]. The Valpo team believes that the advent of newer filament types eliminates the need for ABS in the consumer printing market.
PRO Series PETG results characterize the material as a well-rounded filament. The filament is slightly weaker than PLA, but with a ~100% increase in the strain at failure. It has the second highest ductility rating and the second highest isotropic rating. There are still challenges associated with printing in PETG, such as the higher extrusion temperature, but overall PETG has the potential to challenge PLA as the primary filament type.
PRO Series Nylon and NylonX are challenging filaments to print; however, they also come with some unique benefits. If there is a need for prints to exhibit high deformation without failure, Nylon is the suggested filament. NylonX on the other hand is more suitable for weight-dependent applications, like custom drone parts.
[3] P. Azimi, D. Zhao, C. Pouzet, et al., “Emissions of Ultrafine Particles and Volatile Organic Compounds from Commercially Available Desktop Three-Dimensional Printers with Multiple Filaments,” Environmental Science and Technology, Vol. 50, pp 1260-1268, Jan. 2016.
5. CONCLUSION
The research team at Valparaiso University is working to inform the consumer FFF community on how slicer settings, particularly hotend temperature, affect tensile properties of different filament materials. The results can dispel many traditional myths regarding consumer FFF printing, and they will hopefully aid both experienced and novice 3D printer users in determining the most applicable filament for their project. FFF printers have many variables that affect part strength outside of just the slicer settings; therefore, it is not recommended to use this data to estimate the strength of printed parts. Instead, the research team suggests you look at the relative values to determine how different filament types will likely perform on your own printer. The most appropriate slicer settings for other hotend models, filament diameters, nozzle diameters, etc.… may vary widely. The Valpo team hopes the results presented in this report encourage users to consider how all these variables might affect printed parts, and the team hopes future experiments will only increase parameter awareness.
The Valpo team is always looking for ways to assist the consumer FFF community. You can vote on the next area of research by visiting our social media accounts on the next page!
ABOUT THE ACCELERATED 3D PRINTING LAB AND VALPARAISO UNIVERSITY
The Accelerated 3D Printing Lab is located in the College of Engineering at Valparaiso University. Engineering at Valpo is an undergraduate only program that is consistently ranked in the top 20 undergraduate engineering programs in the nation by U.S. News & World Report. The Accelerated 3D Printing Lab was established in the Summer of 2018 to support Valpo’s additive manufacturing research. Students investigate a variety of traditional and novel additive manufacturing methods with the intent of open access to the research.
ABOUT THE AUTHORS
Samuel Hart ’17 and Trevor Gray ’20 tested over 2000 specimens to discover how slicer settings affect the tensile strength of parts. The results in this paper would not be possible without their hard work and dedication. Dr. Daniel Blood, Assistant Professor of Mechanical Engineering and Bioengineering at Valpo, oversaw the work performed by Sam and Trevor.

Additional thanks to Kelsey Unser, Rima Miller, Tyler Smar, and William Foy for their help in setting up the research.
Valparaiso University College of Engineering Website
Accelerated 3D Printing Lab Facebook: @Accelerated3DPrintingLab
Twitter: @printing_lab
SPECIAL THANKS TO DAVE GAYLORD AT MATTERHACKERS
The Valpo team appreciates MatterHackers’ donation of filament for these tests, and also for Dave’s invaluable input on testing. All filaments tested in this report are available at their online store.
Shop 3D Printing:
www.matterhackers.com
MatterHackers Facebook:
@MatterHackers
Twitter:
@MatterHackers
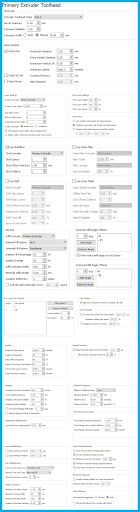
APPENDIX - SIMPLIFY3D SETTINGS